or_dat <- data.frame(x1 = c(1:4),
                  x2 = c(5:8),
                  x3 = c(9:12))


ref_dat <- data.frame(x1 = runif(4, min = 1, max = 4),
                      x2 = runif(4, min = 5, max = 8),
x3 = runif(4, min = 9, max = 12))gap statistic method
gap statistic method에 대해 알아보겠습니다. 알고리즘의 대략적인 순서는 다음과 같습니다.
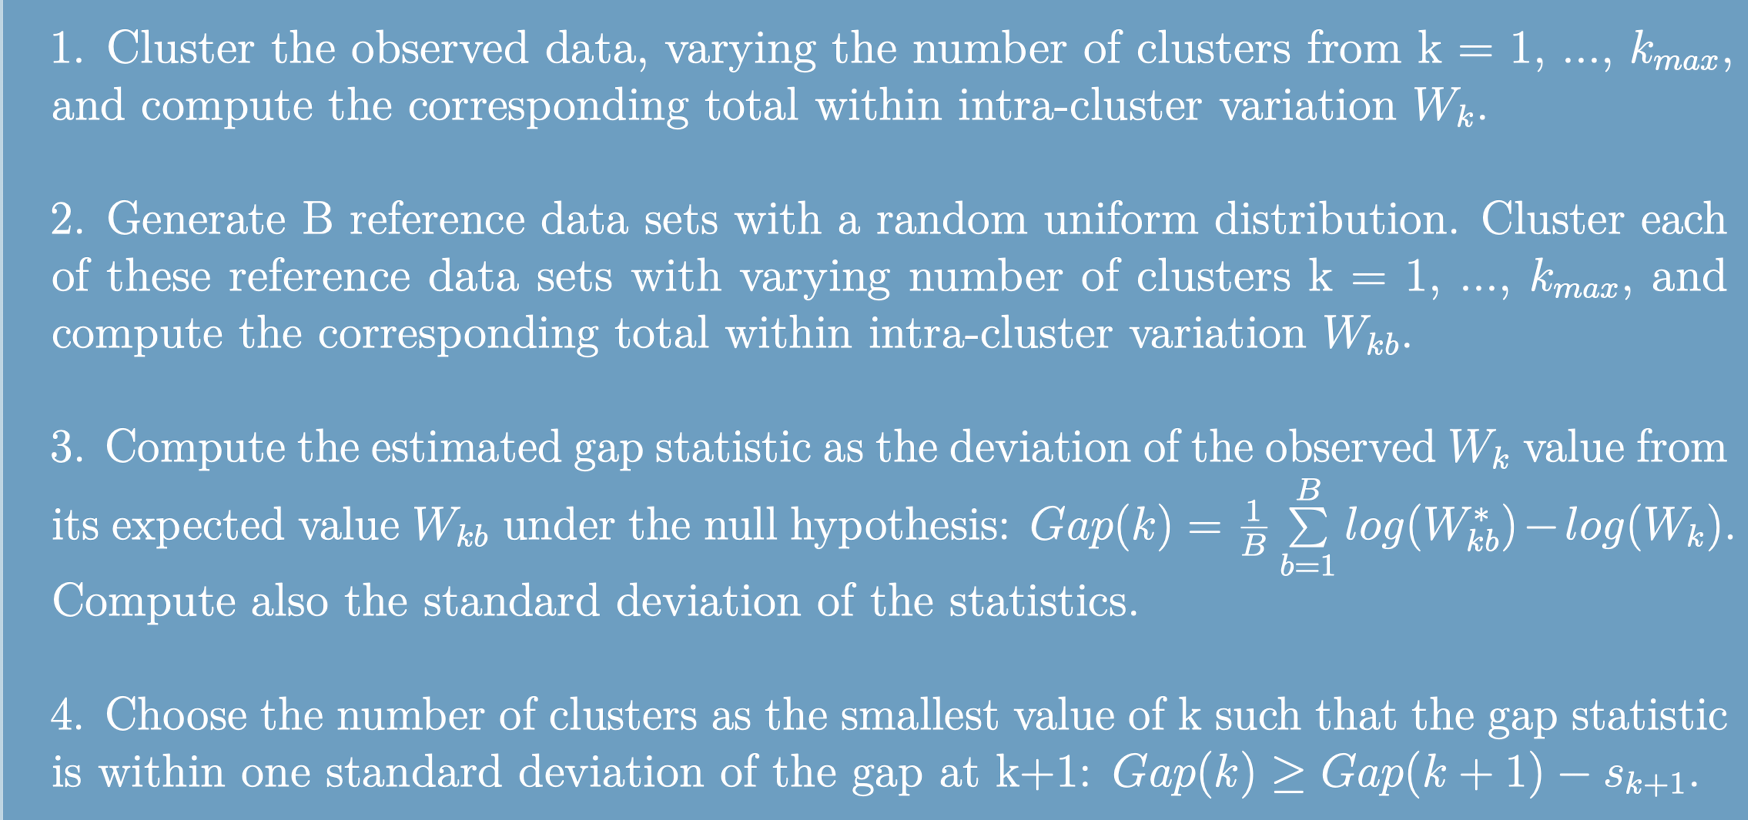
- \(k = 1, \cdots , k_{max}\)에 대해 \(W_k\)(군집 내 변동의 총합)를 계산
\[ \begin{aligned} W_k = \sum_{k = 1}^k W(C_k) &= \sum_{k = 1}^k \sum_{x_i \in C_k} (x_i - \mu_k)^2, \\ &C_k : \text{군집 번호} \\ &x_i : C_k\text{ 에 속하는 관찰값} \\ &\mu_k : C_k \text{에 속하는 관찰값들의 평균} \end{aligned} \]
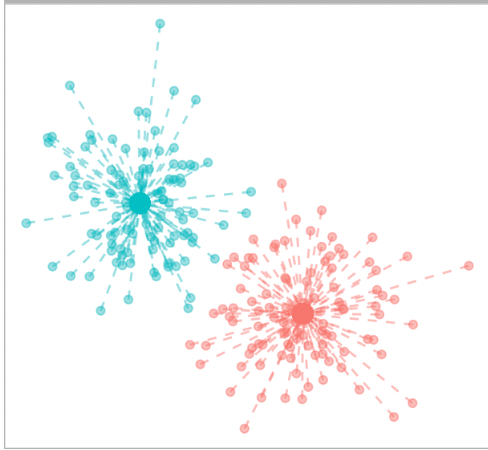
간단하게 그림처럼 각 군집별로 군집내 변동을 구하고, 전부 더해서 \(W_k\)를 구해줍니다.
- reference data를 uniform distribution으로부터 생성하고 \(W_{kb}\) 를 계산
우선 reference data를 어떻게 생성하는지 알아보겠습니다. reference data는 실제 데이터의 각 칼럼별 range(min ~ max) 값을 기준으로 uniform distribution을 통해 생성합니다(ex.unif(range(col1))). 이를 \(B\) 번 반복해서 reference data를 \(B\)개 생성합니다.
\(B\)개 reference data를 생성했으니 각 reference data에 대해서 1번에서 했던 것과 동일하게 \(W_k\)를 구합니다(\(W_{kb}\)).
- Gap statistc 계산
\[ Gap(k) = \frac{1}{B}\sum_{b = 1}^B log(W_{kb}^*) - log(W_k) \] gap statistic은 reference data로부터 구한 \(log(W_{kb})\)의 평균과 실제 데이터로부터 구한 \(log(W_k)\)의 차이로 정의됩니다.
- 아래 조건을 만족하는 \(k\) 선택
\[ \begin{aligned} Gap(k) &\ge Gap(k+1) - s_{k+1} \\ &where \quad s_{k+1} = sd_{k+1}\cdot\sqrt{1 + \frac{1}{B}}, \quad sd_{k} = log(W_{kb}^*)\text{의 표준편차} \\ \end{aligned} \]
논문에서 추천하는 방법은 위의 수식처럼 reference data의 표준편차를 활용하여, 최적의 \(k\)를 선택하는 것입니다.
이렇게 하는 이유는 gap statistic이 변화율을 고려하여, 적절한 \(k\) 값을 선택하기 위함입니다. 즉, gap statistic이 클수록 좋지만 gap statistic이 느리게 증가하는 지점을 찾아서 모델의 간결성 또한 확보하기 위함입니다.
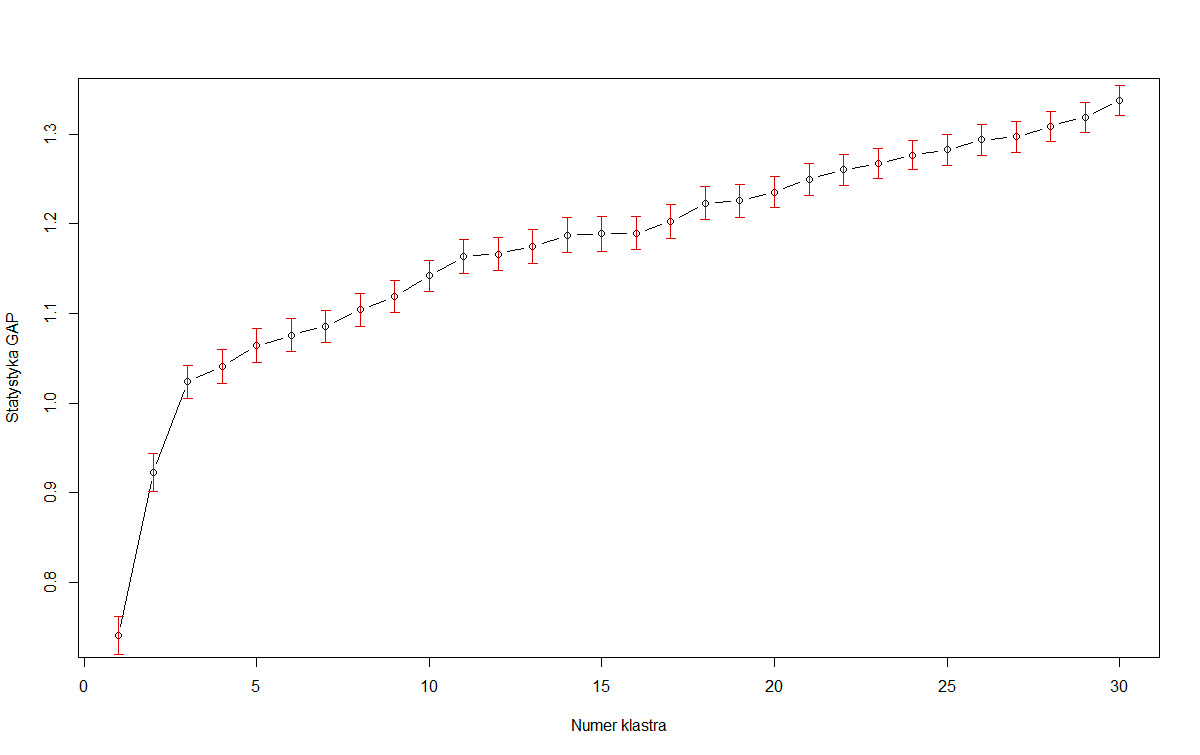
그림처럼 gap statistic이 구해진 경우 gap statistic이 가장 클 때를 기준으로 선택한다면 \(k = 30\)이 선택됩니다. 이렇게 \(k\)값에 따라 gap statistic이 계속 증가할 경우 모형의 복잡성이 증가하기 때문에 적절하지 않은 모형이 선택될 수 있습니다. 이를 보정하기 위해 위에서 설명한 reference data의 표준편차를 이용한 1-standard-error method를 이용합니다.
논문 저자가 추천한 방법은 1-standard-error method이지만 gap statistic을 구할 때 사용하는 cluster 패키지의 clueGap() 함수의 경우 다음과 같은 방법을 지원합니다.
globalmax : gap statistic의 maximum 값 선택
firstmax : gap statistic의 첫 번째 local maximum 값 선택
기타 등등
Example
library(tidyverse)
library(factoextra)
df_6 <- scale(USArrests)
df_6 %>% head() Murder Assault UrbanPop Rape
Alabama 1.24256408 0.7828393 -0.5209066 -0.003416473
Alaska 0.50786248 1.1068225 -1.2117642 2.484202941
Arizona 0.07163341 1.4788032 0.9989801 1.042878388
Arkansas 0.23234938 0.2308680 -1.0735927 -0.184916602
California 0.27826823 1.2628144 1.7589234 2.067820292
Colorado 0.02571456 0.3988593 0.8608085 1.864967207set.seed(12)
fviz_nbclust(df_6, kmeans, method = "gap_stat")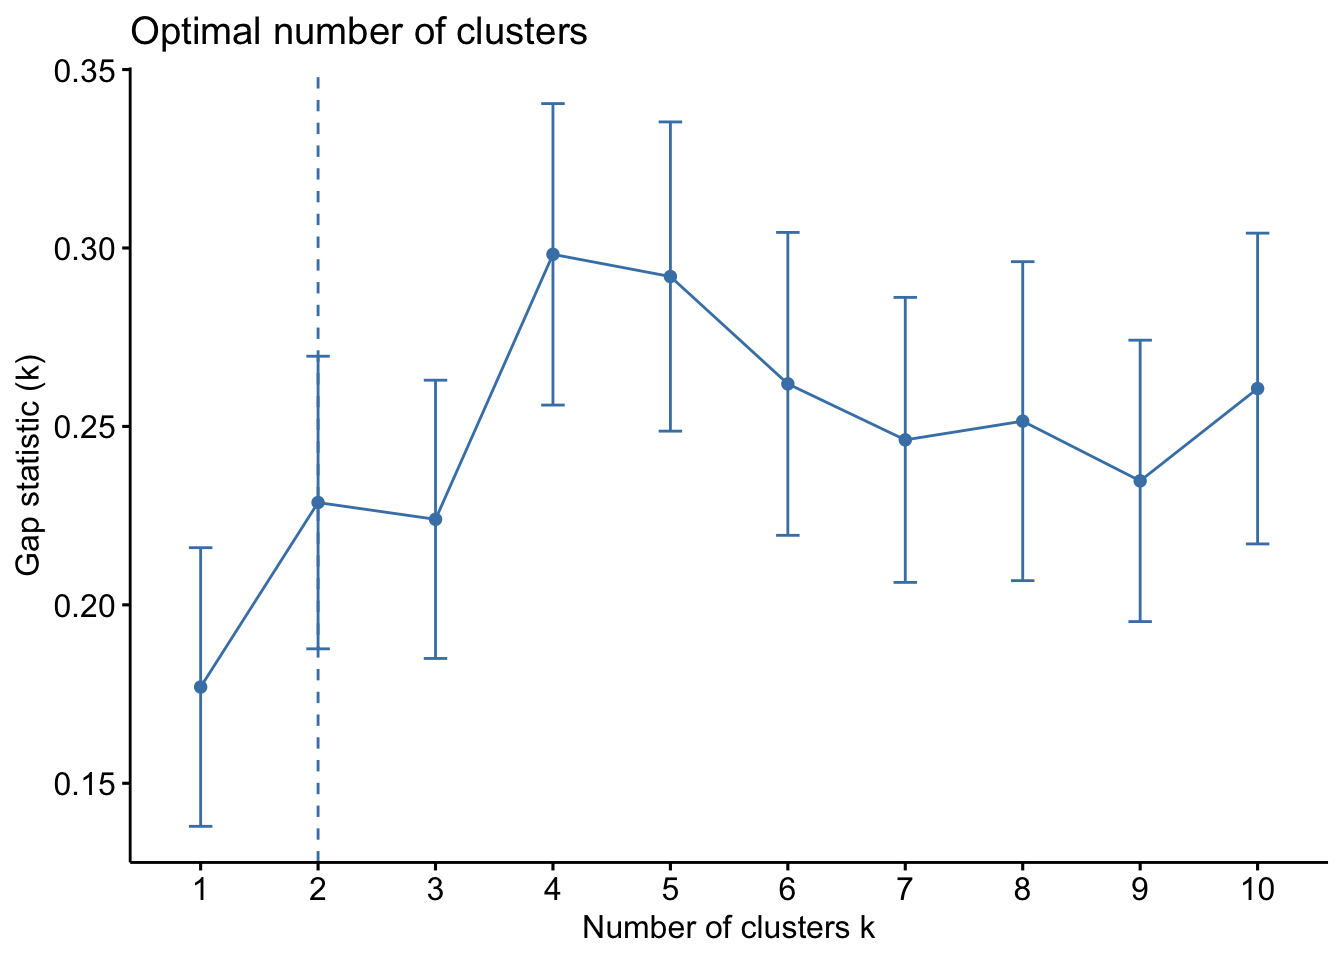
fviz_nbclust()의 경우 1-standard-error method를 이용해서 계산됩니다. 그래프를 보면 \(k = 3\)일 때, \(gap(3) - s.e \approx 0.18\) 정도인 것을 알 수 있고, \(gap(2) \approx 0.23\) 정도인 것을 알 수 있습니다. 따라서 \(gap(2) \ge gap(3) - s.e\)이므로 \(k = 2\)가 선택됩니다.
시험에서는 근거만 제시하면 되기 때문에 그래프를 보고 1-standard-error method로 표시된 점선을 최적의 \(k\)로 선택하는 것이 자연스러울 것 같습니다.
Citation
BibTeX citation:
@online{don2022,
  author = {Don, Don and Don, Don},
  title = {Gap Statistic},
  date = {2022-10-08},
  url = {https://dondonkim.netlify.app/posts/2022-10-07-gap-stat/gap_stat.html},
  langid = {en}
}
For attribution, please cite this work as:
Don, Don, and Don Don. 2022. “Gap Statistic.” October 8,
2022. https://dondonkim.netlify.app/posts/2022-10-07-gap-stat/gap_stat.html.